ELK Opennetmon
elk-opennetmon
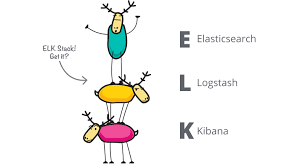
In this post, we will be integrating the ELK (Elasticsearh, Logstash, Kibana) stack with Opennetmon for network traffic visualization. We will be using Filebeat to forward the network logs generated by the SDN controller to logstash for processing.
Setting up elk container
(original source : http://elk-docker.readthedocs.io/). The following commands are used:
$ sudo docker pull sebp/elk
$ sudo docker run -p 5601:5601 -p 9200:9200 -p 5000:5000 -it --name elk sebp/elk
Open ports description:
1. 5601 - Kibana web interface
2. 9200 - Elasticsearch JSON interface
3. 5000 - Logstash forwarder
Running ELK stack
First verify elasticsearch is up. On base machine hit http://{base machine Ip}:9200.
Download and install Filebeat on base machine and start the daemon
$ curl -L -O https://download.elastic.co/beats/filebeat/filebeat_1.1.0_amd64.deb
$ sudo dpkg -i filebeat_1.1.0_amd64.deb
Edit filebeat configuration file. Replace the contents of the file from filebeat.yml file in this repository (https://github.com/nkkize/elk-opennetmon) and save it.
$ sudo vi /etc/filebeat/filebeat.yml
Start filebeat daemon
$ /usr/bin/filebeat -e -c filebeat.yml -d "publish"
Inside elk container, we need to the edit logstash configuration file to take input from Filebeat, process input and forward to elasticsearch and start the deamon.
Using below command edit logstash configuration file and replace the contents of the file from logstash.conf file in this repository (https://github.com/nkkize/elk-opennetmon) and save it.
$ sudo vi /etc/logstash/conf.d/logstash.conf
Start logstash daemon
$ /opt/logstash/bin/logstash -f logstash.conf
Start your topology and start POX with opennetmon.
./pox.py opennetmon.startup
On base machine open browser and hit http://{base machine Ip}:5601/app/kibana. Kibana UI will be up.
In Settings tab search your index. (In logstash.conf, you can set an index name, currently it is set to filebeat-{DATE}).
In discover tab you can see the logs from opennetmon is being fectched.
In visualise and dashboard tab you can create graphs according to your needs.
That’s All!